 |
EDX of Corrosion Products
|
 |
|
EDX of a Stainless Steel Corrosion Product
|
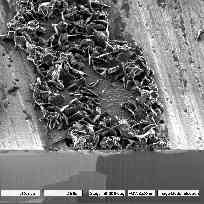
Above: An image taken by FIB microscopy of a piece of stainless steel after it had been
exposed to a corrosive environment at 600oC.
|
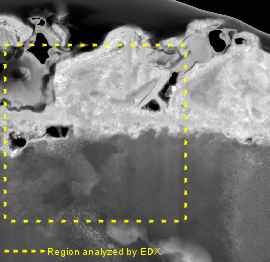
Immediately below: TEM image of the Stainless Steel corrosion product. The yellow square
denotes the area where EDX analysis was done.
|
|
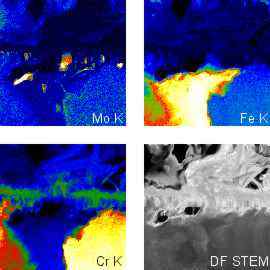
Left: EDX images of the steel
sample, which is marked by the yellow square in
the image above. The k-shell transition intensity under
the bombardment of X-rays with specific
energies are shown as gradations through
a spectra. The top left picture in the image to the left denotes
the intensity of transitions for the
Molybdenum k-shell, the top right shows
Iron, the bottom left displays Chromium,
and the final image in the bottom right is
a Dark-Field STEM, allowing the
chemistry to be compared to grain
orientation and electron attenuation.
|
|